We’re using Go to write Dolt, the world’s first and only version-controlled SQL database.

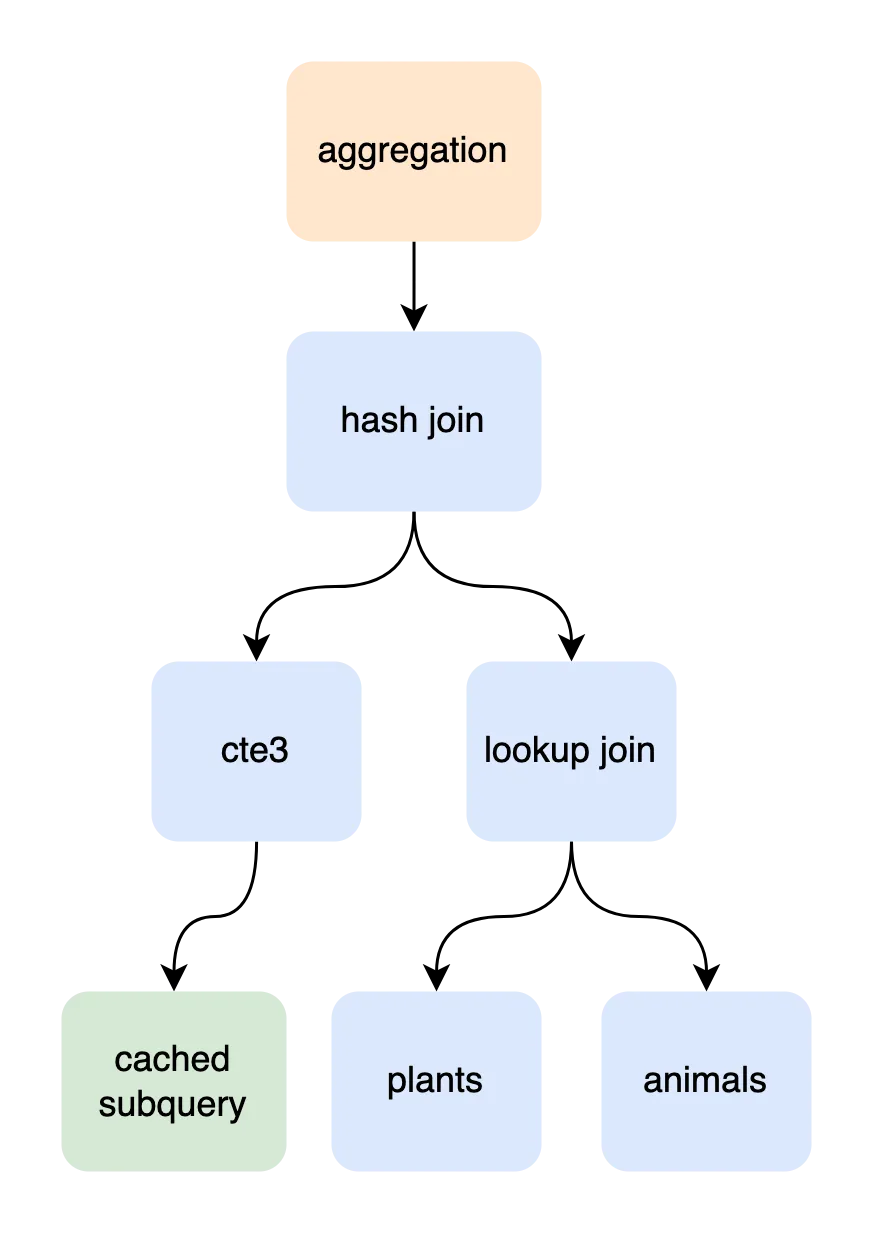
As a database program, Dolt has to deal with lots of large data objects. Oftentimes, these large objects are deeply nested, with structs containing fields that are themselves large structs going down several layers. In particular, like most database servers, Dolt represents the execution plan for a query as a tree of objects, something like this.

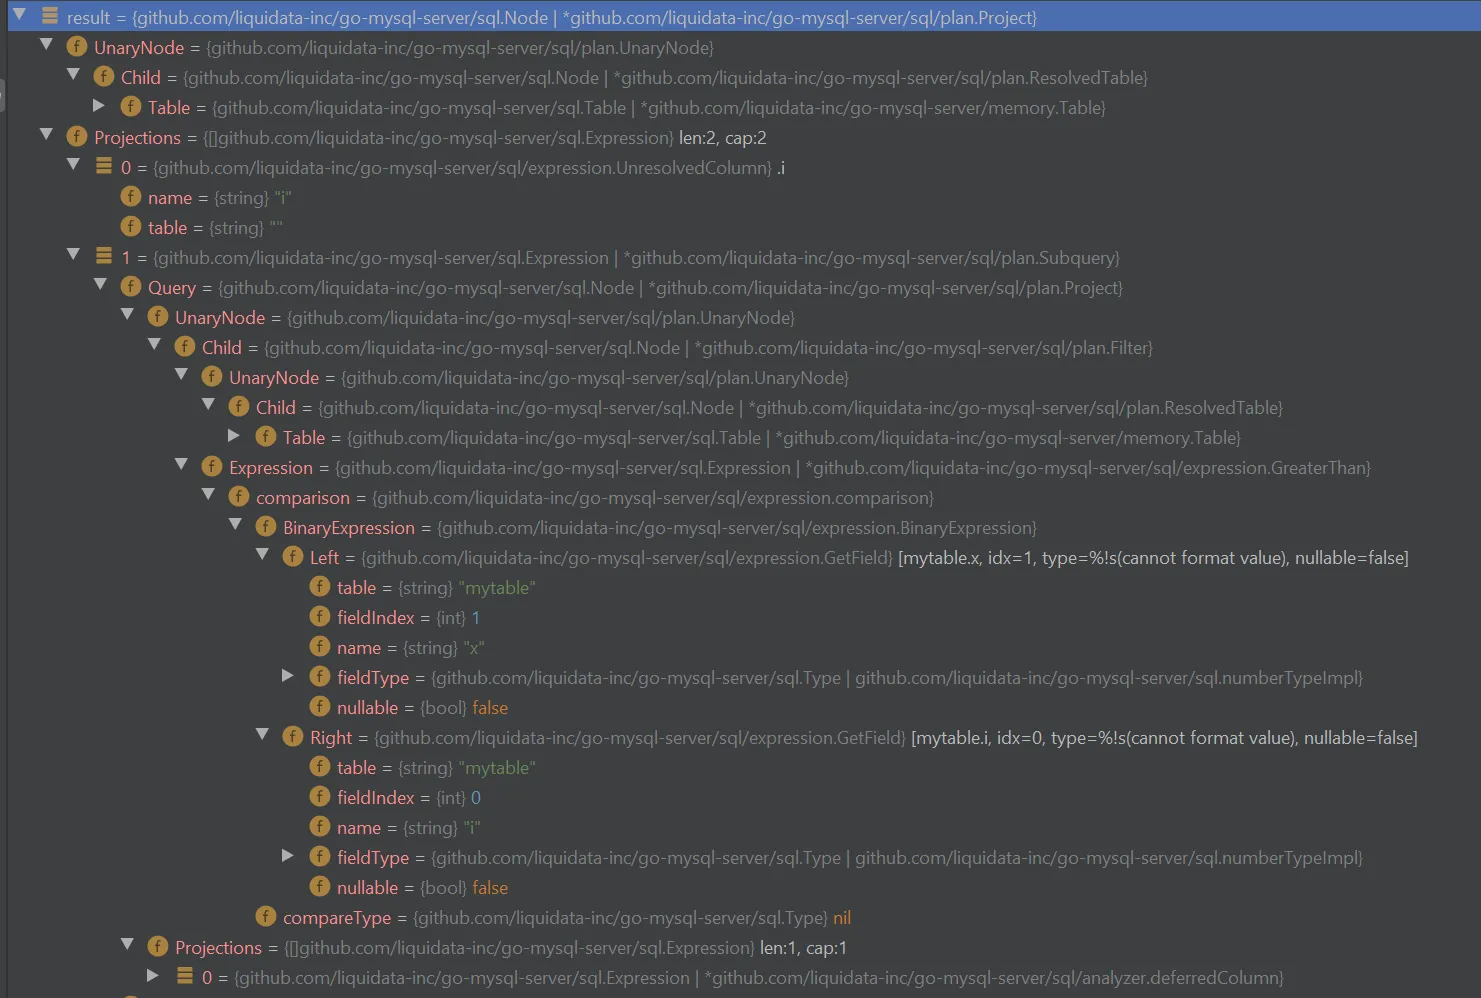
When we find a bug in a query, we spend a lot of time digging into these plans to discover what’s wrong. In a debugger, this is pretty tedious because of how deeply nested these structures are.

So over time, we’ve come to rely more and more on a pseudo-standard to make examining these
structures easier: the DebugString() method.
What’s a pseudo-standard?#
As the name implies, a pseudo-standard is a practice that has achieved somewhat wide adoption
despite never being formally specified anywhere. This is certainly the case with the DebugString()
method on Go objects, which you won’t find defined in the fmt package next to String(). But you
will find it in tens of thousands of source files on
GitHub.
Because Go has implicit interface implementation, it’s trivially easy for this kind of pseudo-standard to spread. In many other statically typed languages, such as Java, interfaces must be implemented explicitly: you have to tell the compiler a type implements an interface, or it isn’t valid to use it as that interface.
public class Example implements MyInterface {
  ...
}
But Go shares a property with many dynamically typed languages such as Ruby: if a type satisfies all the methods of an interface, it implements that interface, no need to declare that fact. Ruby called this “duck typing” (if it looks like a duck and quacks like a duck, it must be a duck), and Python does too. I’ve never heard it called this in Go, but it’s the same concept, with the added benefits of static typing so you find incompatibilities at compile time instead of at runtime.
For DebugString(), the interface looks like this:
type DebugStringer interface {
	DebugString() string
}
And of course, because of implicit interface implementation, there’s no need for any client code
following this pseudo-standard to declare that it’s doing so, to agree on the one true source of the
DebugString() method, or even to be aware that it’s implementing an interface at all! You can just
write methods and people get the DebugString() behavior if they opt into it. Here’s what this
looks like in our query planner code:
// DebugString returns a debug string for the value given.
func DebugString(nodeOrExpression interface{}) string {
	if ds, ok := nodeOrExpression.(DebugStringer); ok {
		return ds.DebugString()
	}
	if s, ok := nodeOrExpression.(fmt.Stringer); ok {
		return s.String()
	}
	return fmt.Sprintf("unsupported type %T", nodeOrExpression)
}
Dolt’s use of DebugString()#
We first wrote about our use of DebugString() way back in
2020. Many of our query plan
objects implement this pseudo-interface to give us detailed debugging information in a text
format. Since the query plan is a tree of nodes, we print it formatted as a tree.
explain
select p.category, p.name, a.name
from animals a join plants p
on a.category = p. category
where a.category = 7

+-----------------------------------------------+
| plan                                          |
+-----------------------------------------------+
| Project                                       |
|  ├─ columns: [p.category, p.name, a.name]     |
|  └─ LookupJoin                                |
|      ├─ (a.category = p.category)             |
|      ├─ TableAlias(p)                         |
|      │   └─ Table                             |
|      │       ├─ name: plants                  |
|      │       └─ columns: [name category]      |
|      └─ Filter                                |
|          ├─ (a.category = 7)                  |
|          └─ TableAlias(a)                     |
|              └─ IndexedTableAccess(animals)   |
|                  ├─ index: [animals.category] |
|                  └─ columns: [name category]  |
+-----------------------------------------------+
Over time we’ve fine-tuned this output to include more or less information based on the presence of various environmental flags. Examining these textual summaries has been a huge time saver and enables us to find and fix bugs much more quickly.
We also leverage them to quickly spot changes introduced by our query planner as it runs. Our planner is a series of several dozen transformation functions, each of which optionally mutates the tree in some way. It’s possible, but tedious, to step through these transformations one by one in a debugger. A much faster method is to have it produce a log of what changed at each transformation step, represented by the diff between the textual representations of the before and after state. The code to do this:
func (a *Analyzer) LogDiff(prev, next sql.Node) {
    if a.Debug && a.Verbose {
        if !reflect.DeepEqual(next, prev) {
            diff, err := difflib.GetUnifiedDiffString(difflib.UnifiedDiff{
                A:        difflib.SplitLines(sql.DebugString(prev)),
                B:        difflib.SplitLines(sql.DebugString(next)),
                FromFile: "Prev",
                FromDate: "",
                ToFile:   "Next",
                ToDate:   "",
                Context:  1,
            })
            if err != nil {
                panic(err)
            }
            if len(diff) > 0 {
                a.Log(diff)
            }
        }
    }
}
It produces output like this:
INFO: default-rules/0/resolve_subquery_exprs/default-rules/0/resolve_subquery_exprs: --- Prev
+++ Next
@@ -3,5 +3,5 @@
  ├─ Grouping()
  - └─ Filter([two_pk.pk2, idx=7, type=TINYINT, nullable=false] IN (Project(pk2)
  -     └─ Filter(c1 < opk.c2)
  -         └─ UnresolvedTable(two_pk)
  + └─ Filter([two_pk.pk2, idx=7, type=TINYINT, nullable=false] IN (Project([two_pk.pk2, idx=14, type=TINYINT, nullable=false])
  +     └─ Filter([two_pk.c1, idx=15, type=TINYINT, nullable=false] < [opk.c2, idx=2, type=TINYINT, nullable=false])
  +         └─ Table(two_pk)
Other uses of DebugString()#
We use DebugString() pretty extensively, and you should too! Not just because it’s a handy tool,
but because the more projects that make use of it the more it becomes cemented as a pseudo-standard
and the more tools get built around it.
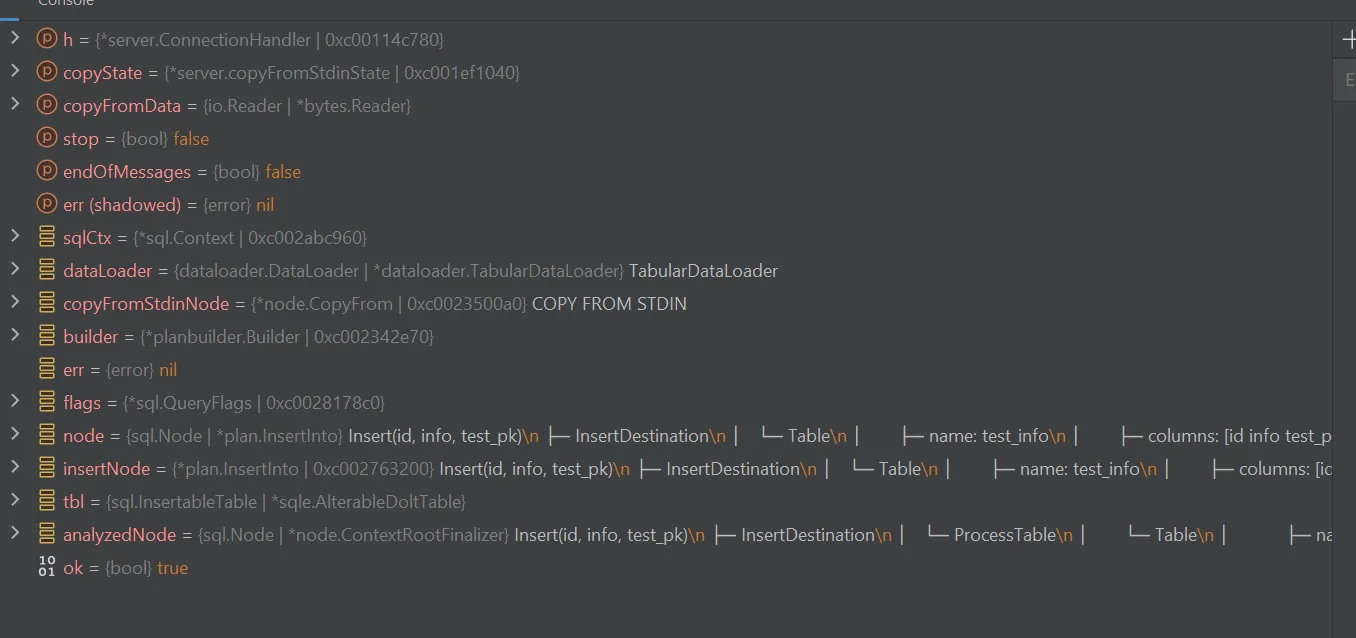
JetBrains’s excellent Go IDE GoLand has used DebugString() in its
GUI debugger for many years, and just recently introduced a new
feature
that makes it much more useful: now you can call other methods in your DebugString() methods
(rather than just returning a string concatenation).
Now I can see a detailed summary of the contents of an object at a glance without digging into it.

Conclusion#
Want to talk about debug strings, or Go pseudo-standards? Or maybe you’re curious about Dolt, the world’s first version-controlled SQL database? Come by our Discord to talk to our engineering team and meet other Dolt users.