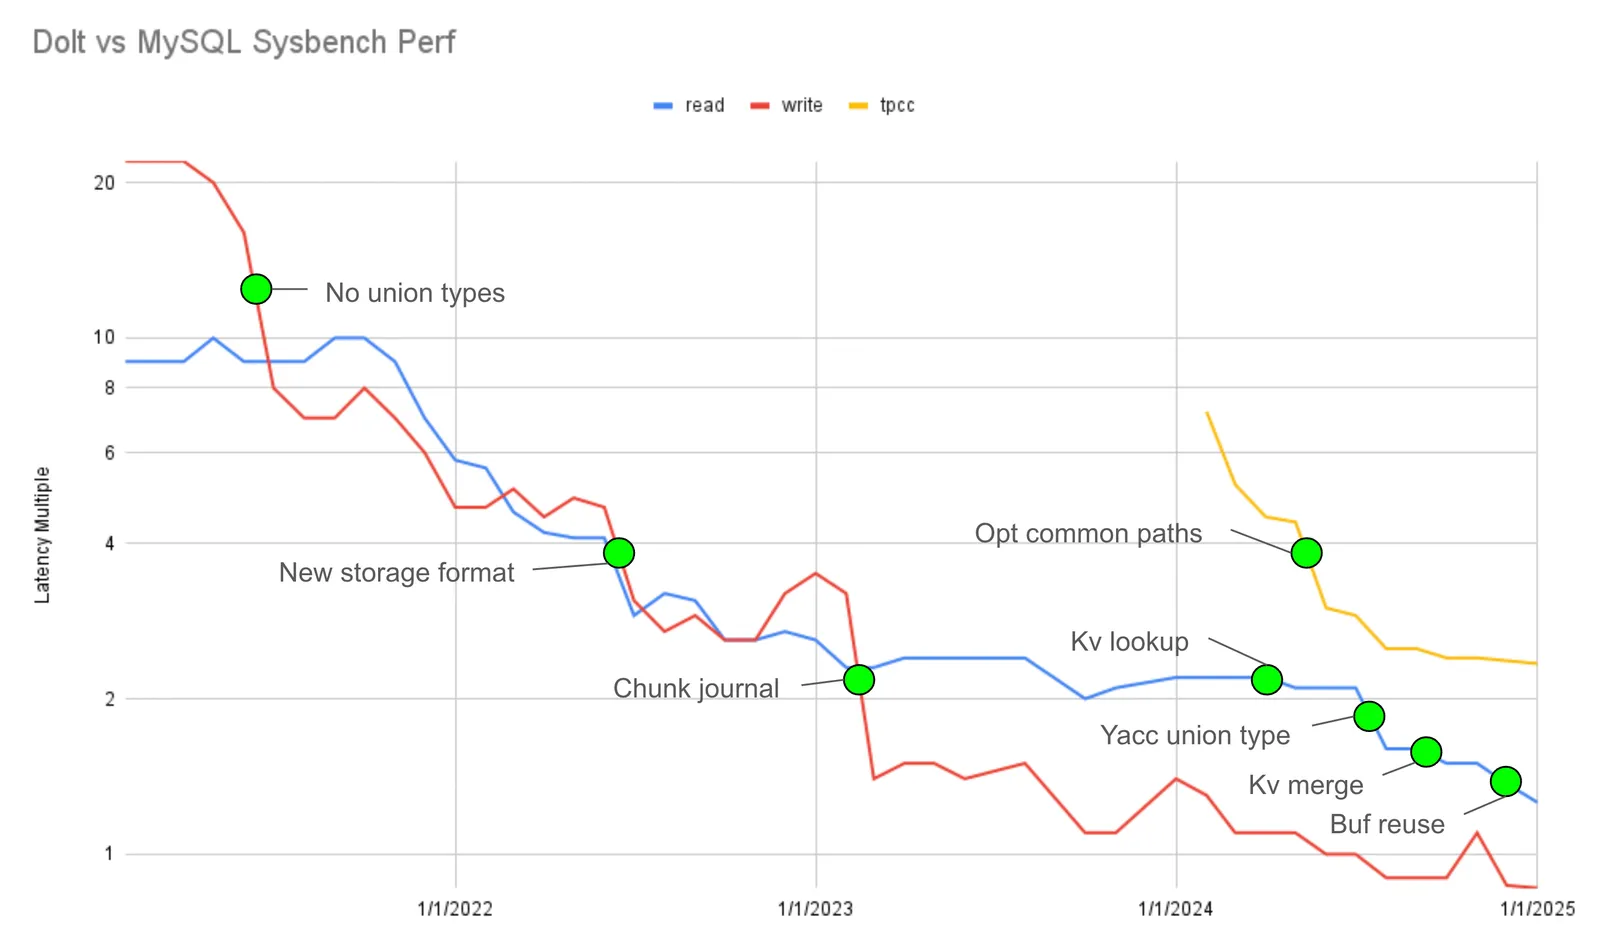
Four years ago DoltDB was about 15x slower than MySQL. At the time, we faced skepticism regarding Prolly-tree performance and scalability. Last year, the first production-grade DoltDB aspired to ~2x read latency compared to MySQL. This meant that a MySQL query of 1 second would take 2 seconds in Dolt. Now, we are starting to outperform MySQL at bread and butter queries. Our latest sysbench read/write performance is 25% slower and 13% faster, respectively.
This blog will give a brief performance summary of the last year. Shortly we will need to expand our set of benchmarks and expand our long tail of “hardened” queries. And soon we may add PostgreSQL to our performance comparisons, which is the same latency distance from MySQL as MySQL was from us a year ago (~2x).
Background#
Every night we run a series of benchmarks using the sysbench tool. Our sysbench queries are run with in-memory databases, on AWS linux servers, testing the full networking stack with the same wire serialization format and client.
The sysbench queries below were selected because every customer runs them, they touch unique code paths, and the paths cover every layer of our stack:
- query parsing
- query optimizing
- statistics maintenance and costed analysis
- KV storage engine
- execution compute graph
- execution data plane
- I/O spooling interface
These fundamentals are fairly hardened. We track differences to the hundredth of a millisecond (10’s of nanoseconds) and single digit percentage points.
We also include TPC-C below, which is orthogonal to sysbench and measures transaction per second (TPS) throughput. The benchmark mainly runs small (<>1ms) queries, which are maybe not as representative of our customers’ full workloads.
The nature of our customer’s workloads, selection of tests, and the way we benchmark means that the DoltDB production experience over the last four years has tracked sysbench performance.
Notable Changes#
The figure below plots Dolt latency divided by MySQL latency on the y-axis, and Dolt version over 4 years on the x-axis. Three lines separate aggregate sysbench read performance, write performance, and TPC-C transactions per second (TPS). The y-axis gridlines are log-spaced.

All write benchmarks are correlated. They touch every layer of the stack but INSERT, UPDATE, and DELETE only vary slightly in code footprint. Early changes to these include Brian’s work on the noms type system. Andy’s work on the storage format (1) decouples type identifiers from the fields they describe, and (2) deserializes rows at the field level rather than wholesale. The next big write jump is the chunk journal, which streams writes to one file rather than each SQL transaction producing a new file. Each of these changes are highlighted by a green circle in the plot above.
The last green circle highlights small query improvements to TPC-C, which overlap with the “small read” queries we look at next.

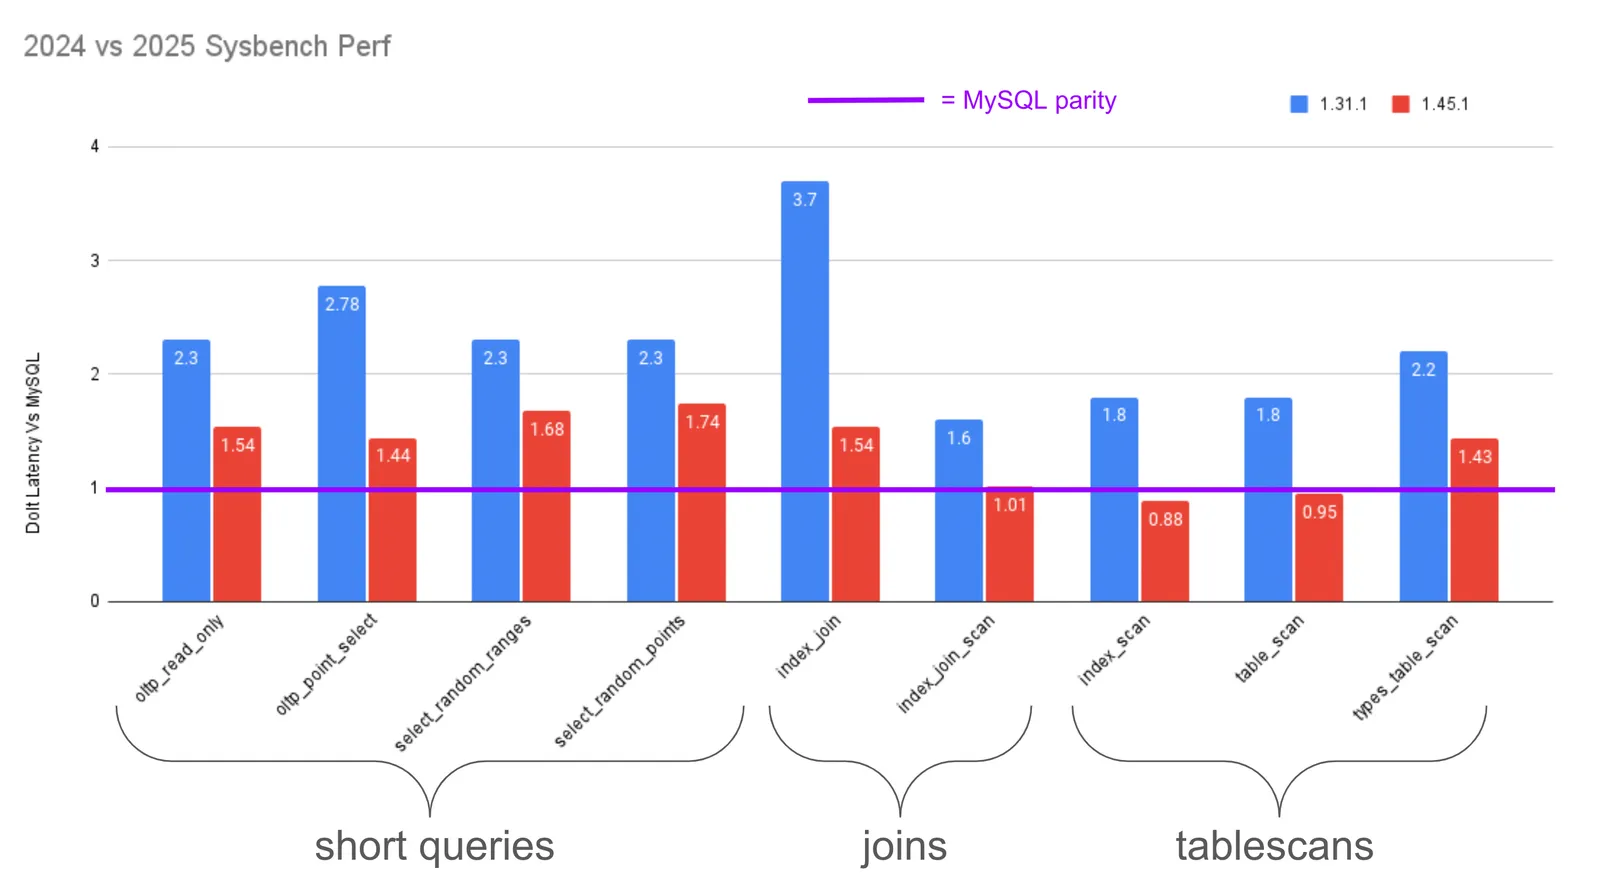
The graph above compares read queries between two Dolt versions at the start of 2024 and 2025. Read queries are less correlated. What makes one read fast can make other reads slow. And there are so many more patterns of read queries.
The read benchmarks are ordered from short to long, from oltp_point_select at 27ms to types_table_scan at 106ms. We grouped benchmarks into three buckets. “Small queries” look similar to select id from table where id=?. “Joins” are a merge and lookup join. And “tablescans” look like select * from table.
Dozens of changes contributed to small query performance, which we have documented here, here and here). One example is parser efficiency, which led to a 15% latency improvement for small queries.
We wrote two new execution operators for lookup and merge joins.
We will soon write about how standardizing row lifecycles eases the Go runtime’s GC pressure. This primarily benefits tablescans that read and write many rows to disk.
The changes for tablescans are ongoing and we will write about in the future. The summary of changes include (1) minimizing unnecessary interface{} return values, (2) streamlining our type-specific wire-serialization handlers, and (3) reusing the buffers used to internetwork results.
Future#
We have many more performance improvements planned. types_table_scan inefficiently dereferences out of band text fields at the moment. The analyzer has three intermediate representation formats that can be combined for speeding small queries. We have a prototype that refactors the execution runtime that can reuse row buffers and avoid heap allocating interface{} return values when accessing key-value pairs. And hiding COMMIT latency would improve TPC-C by up to 2x in some cases. And after we finish these, I’m sure there will be a whole new set of performance bottlenecks to follow-up on.
Summary#
There is still slack left to improve DoltDB’s OLTP performance. But 2024 was a good year, we are now 25% slower than MySQL at reads and 13% faster at writes.
If you have any questions about Dolt, databases, or Golang performance reach out to us on Twitter, Discord, and GitHub!